
Clients don’t hire a Google Ads agency to collect clicks. They hire one to drive measurable business results and to explain those results without hand-waving. A well-built Google Ads KPI dashboard makes that possible because it keeps the conversation anchored to outcomes, not activity. In 2026, that matters more than ever: privacy constraints, multi-device journeys, and longer sales cycles can all blur the line between what ads influenced and what they truly caused.
Start With Business Outcomes
The fastest way to make reporting useful is to organize your dashboard the way a business owner thinks:
- Business impact: profit (or contribution margin), revenue, pipeline, booked calls, new customers
- Efficiency: CPA, ROAS, conversion rate, cost per qualified lead
- Coverage and constraints: impression share, lost impression share, budget limits, rank limits
- Quality checks: search terms, landing page engagement, form completion, call quality
This structure also prevents a common reporting trap: focusing on top-of-funnel metrics that look “busy” while sales stay flat.
Spend, CPA, ROAS, and Conversion Rate: Your Core Dashboard View
An agency dashboard should answer three questions in under a minute:
- What did we get this period (sales, leads, pipeline)?
- What did it cost (spend and unit economics)?
- What limited growth (budget, rank, conversion friction, lead quality)?
From there, add a short “drivers” section that calls out the few levers that moved performance: search intent shifts, auction pressure, landing page changes, seasonal demand, or a new offer.
ROAS is not the whole story
ROAS still helps you spot direction, but it can mislead. If a client runs heavier promotions, changes pricing, or sells more low-margin products, revenue-based ROAS may rise while profit drops.
For ecommerce brands, add a profitability view: margin-adjusted ROAS, contribution per order, or profit per click. You don’t need perfect accounting to improve decision making. Even a simple margin tier (high, medium, low) beats treating every dollar of revenue the same.
Enhanced Conversions and Data-Driven Attribution
Two Google features can tighten reporting when cookies and attribution windows fall short:
- Enhanced conversions supplement existing conversion tags by sending hashed first-party data (like email) using SHA-256, which can improve matching and measurement.
- Data-driven attribution assigns conversion credit based on observed interactions across your ads, using account data rather than a fixed rule like last click.
These tools won’t solve every measurement gap, but they can reduce blind spots enough to support better optimization choices.
Search Impression Share: How Much Demand You’re Capturing
When performance looks stable, clients often ask why volume didn’t scale. Impression share metrics help you explain the ceiling.
Google defines impression share as eligibility versus actual impressions, and it breaks out why ads didn’t show. Lost impression share due to rank reflects Ad Rank limits; lost impression share due to budget reflects budget constraints.
This is where Google Ads performance reporting becomes more than a scorecard. If you can point to lost impression share, you can connect missed volume to a clear cause and propose a fix: improve ad relevance and landing page experience, adjust bids, refine targeting, or reallocate spend.
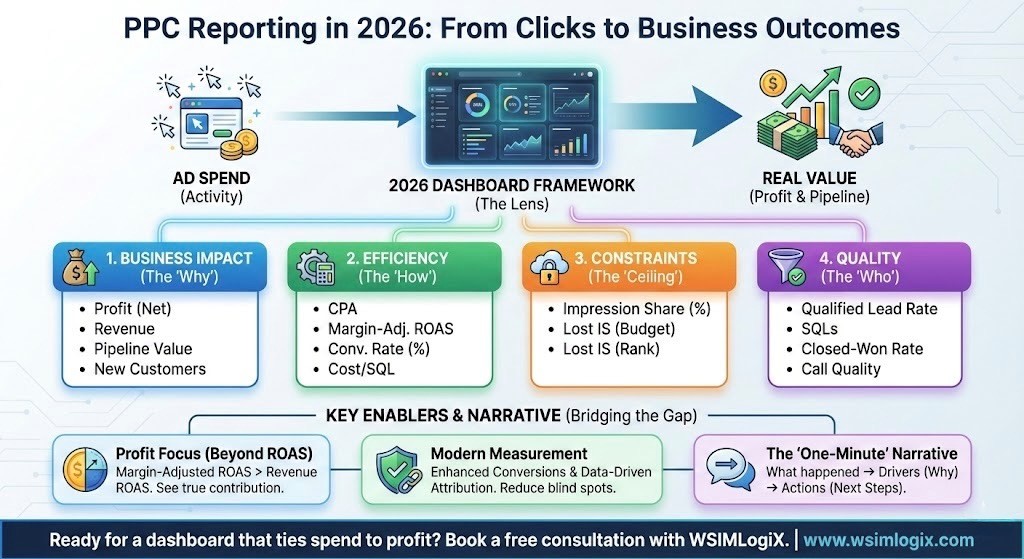
Qualified Lead Rate and Closed-Won Rate: Lead Quality That Matters
For service businesses, “leads” can vary wildly. A dashboard should separate raw volume from outcomes the sales team values. Add at least one of the following:
- Qualified lead rate (sales-qualified, not just marketing-qualified)
- Appointment rate or call connection rate
- Opportunity creation rate
- Closed-won rate (even if delayed)
This is also the right place to introduce offline conversion tracking, so the account optimizes toward real outcomes, not just form fills.
Reporting that clients actually read
A dashboard alone won’t save a report. Pair it with a short narrative that highlights the few numbers that matter and what you’ll do next. Strong agency PPC reporting stays consistent month to month, avoids metric overload, and clearly labels what changed (budget shifts, new landing page, new conversion action, revised match types). Clients don’t need every chart. They need clarity.
Ready to turn your reporting into a client-ready dashboard that ties Google Ads spend to profit, pipeline, and lead quality? Book a free consultation with WSIMLogiX and we’ll map out the exact KPIs, tracking setup, and reporting format your account needs.
Also Read: Next-Gen Ad Formats: Voice, Visual & Contextual Ads to Expand Your Reach
Frequently Asked Questions:
1) What should a monthly Google Ads performance report include for clients in 2026?
A useful report starts with results: sales, qualified leads, or pipeline, plus spend and unit cost (CPA or cost per qualified lead). Then add context: what limited growth (budget or rank), what improved conversion rate, and what you changed. Keep a short list of next steps so the client knows what happens next.
2) How do I set up offline conversion tracking for Google Ads lead generation?
Capture the GCLID on your lead form and store it in your CRM. When a lead reaches a meaningful milestone (qualified, opportunity, closed), import that event into Google Ads as an offline conversion. Google’s setup guide walks through the required fields and process, including mapping conversions back to the original click.
3) How do agencies measure incrementality in PPC without advanced analytics?
Run a controlled test that compares similar audiences: a geo holdout, a limited-time budget split, or a planned reduction in a narrow campaign segment. Track total outcomes, not only “paid-attributed” conversions. If overall sales or qualified leads stay the same after a pause, that spend likely replaced organic demand rather than creating new demand.
4) How long should I wait before judging Google Ads results if my sales cycle is long?
Match your evaluation window to your typical time-to-conversion. For longer cycles, report early indicators (qualified leads, booked calls) weekly and revenue or closed-won monthly or quarterly. Importing downstream events into Google Ads helps the system learn from real outcomes, even when the final sale happens weeks later.
5) What is the best Google Ads KPI dashboard for a digital marketing agency?
The best dashboard is the one that ties ads to business outcomes and stays consistent across accounts. Include impact (profit, revenue, pipeline), efficiency (CPA, ROAS, conversion rate), constraints (impression share and loss reasons), and quality (lead stage or close rate). Build it so a client can understand performance in one glance, then drill down only when needed.